The Outdoors
Black Hills Weather, Climate and Seasons
In an average year the afternoon temperature at Hot Springs, on the southern edge of the Black Hills, reaches 90°F on about 41 days. At Custer, nearly 2,000 feet higher, it does so on about four. Both counts come from the 1991 to 2020 climate normals of NOAA’s National Centers for Environmental Information (NCEI), 30-year averages for each station. This page explains why the Hills are cooler and wetter than the plains around them, what each season brings at four weather stations, the chinook winds and the wild temperature swings of January 1943, and the summer storms that bring hail and, in 1972, a deadly flood.
Why Are the Hills Cooler and Wetter Than the Plains?
Height does most of the work. People sometimes call the Hills an island in a sea of grass, the National Park Service notes, and their sudden rise gives them a climate unlike the plains. The Hills’ dome of rock is about 120 miles long (see How the Black Hills Formed), and a 2002 U.S. Geological Survey study puts the land between 7,242 feet at Black Elk Peak and about 3,000 feet on the plains beside it. Air forced up those slopes cools and gives up its moisture as cloud, rain and snow, which forecasters call orographic lifting.
The National Weather Service’s 1991 to 2020 normals show the difference. Rapid City Regional Airport, at 3,160 feet on the plains east of the city, averages 17.44 inches of precipitation a year; Lead, at 5,350 feet in the northern Hills, averages 31.79. By NCEI’s count, Lead gets a tenth of an inch or more on about 74 days a year, the airport on about 41. The southern Hills are warmer and drier, the Park Service says, and some residents call them South Dakota’s “banana belt.” Custer averages 20.66 inches and Hot Springs 18.61 (NCEI and Weather Service normals, 1991 to 2020; see The Southern Hills).
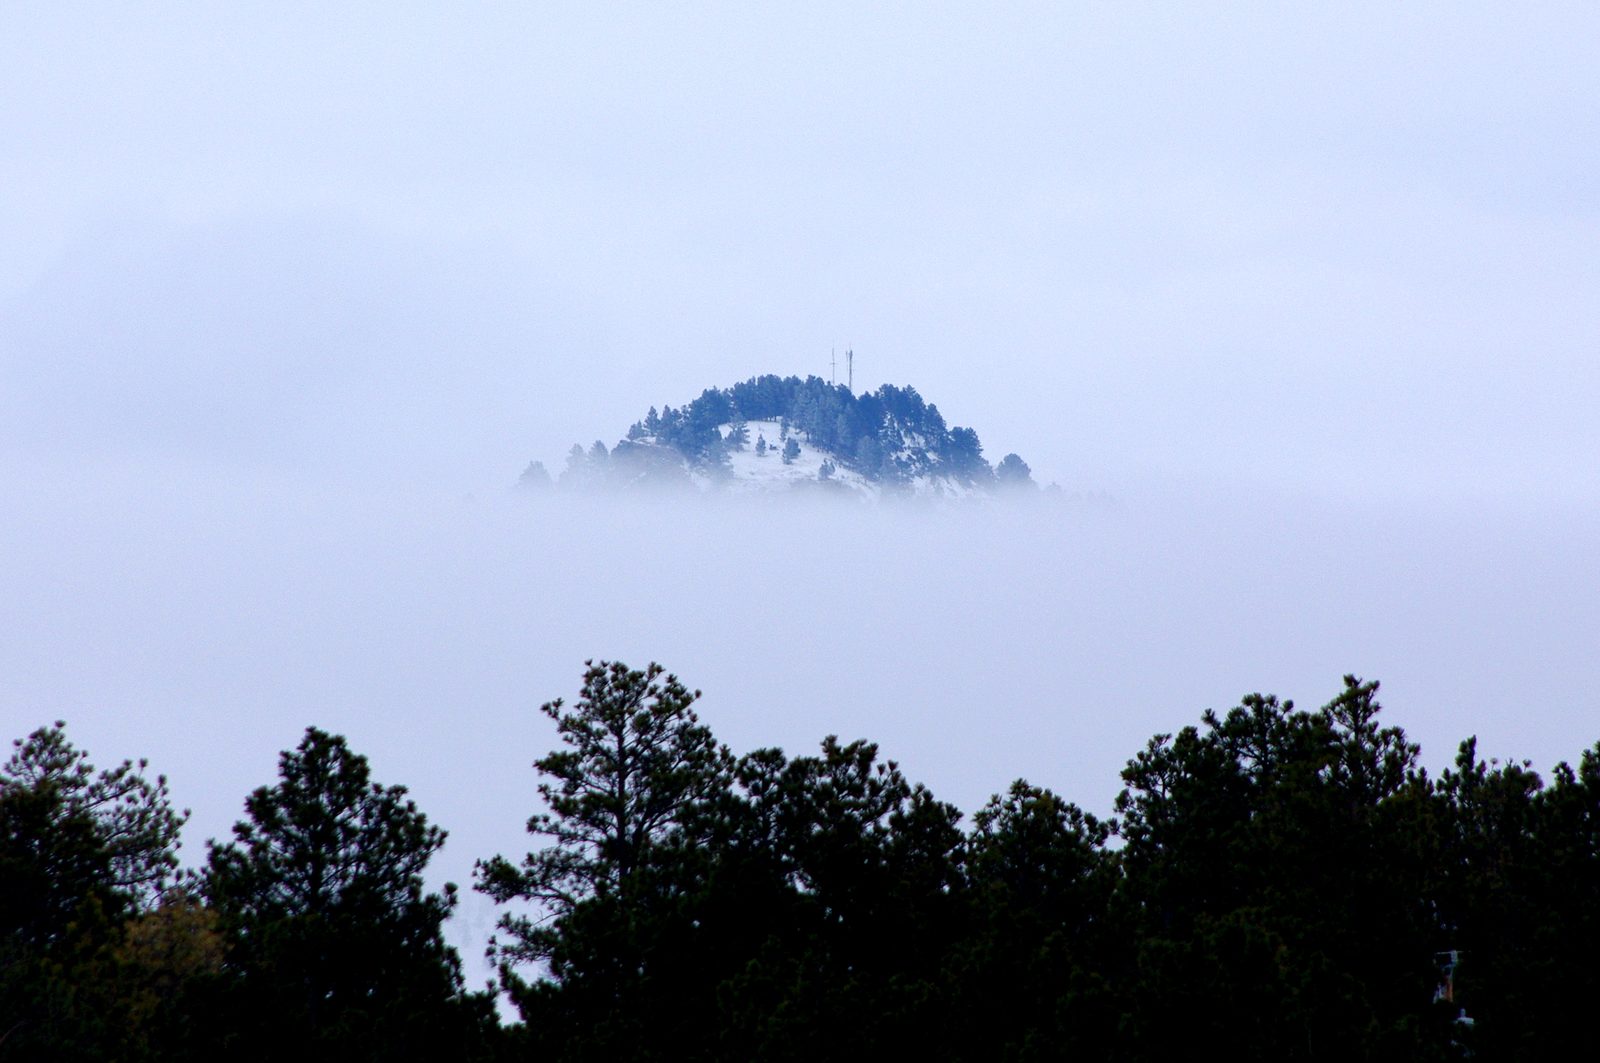
Cooler mostly means cooler summers. In July the normal high is 88°F at Hot Springs and 86°F at the Rapid City airport, but 82°F at Lead and about 80°F at Custer (Weather Service and NCEI normals, 1991 to 2020). Winter nights can reverse the order. Cold air pools on the plains and in valleys under warmer air, an inversion in the Weather Service’s terms. By its 1991 to 2020 normals the January low is 18°F at Lead but 13°F at the airport, 2,190 feet lower, and NCEI counts about 18 days a year at or below zero at the airport, against about 13 at Lead.
The Seasons at Four Weather Stations
Spring is the wet season. In the 1991 to 2020 normals, May is the wettest month at all four stations, from 4.90 inches at Lead to 3.28 at Hot Springs. It is also the least dependable: over 1931 to 1998, the USGS study found, May precipitation in the Black Hills area ranged from about 0.4 inch to 8.5 inches. NCEI’s median date for the last spring freeze (32°F) is May 12 at the airport and May 18 at Custer and Lead. Snow, late or early, belongs to Winter in the Hills.
Summer days are warm and the evenings cool at Wind Cave National Park, the Park Service says. The heat stays on the low ground: NCEI’s 1991 to 2020 normals count about 32 days a year of 90°F or more at the Rapid City airport, against about six at Lead, and Custer’s normal July low is 56°F. June and July often bring severe thunderstorms, the Park Service warns, with large hail and dangerous lightning.
Autumn comes early to the high country. NCEI’s median first fall freeze is September 28 at Custer and October 1 at the Rapid City airport, leaving Custer a typical frost-free season of about 129 days to the airport’s 139 (1991 to 2020). The airport’s Weather Service normals fall from 1.22 inches of precipitation in September to 0.47 in November. In spring and fall alike, the Park Service says, a warm, sunny day may give way to a cool, wet and windy one.
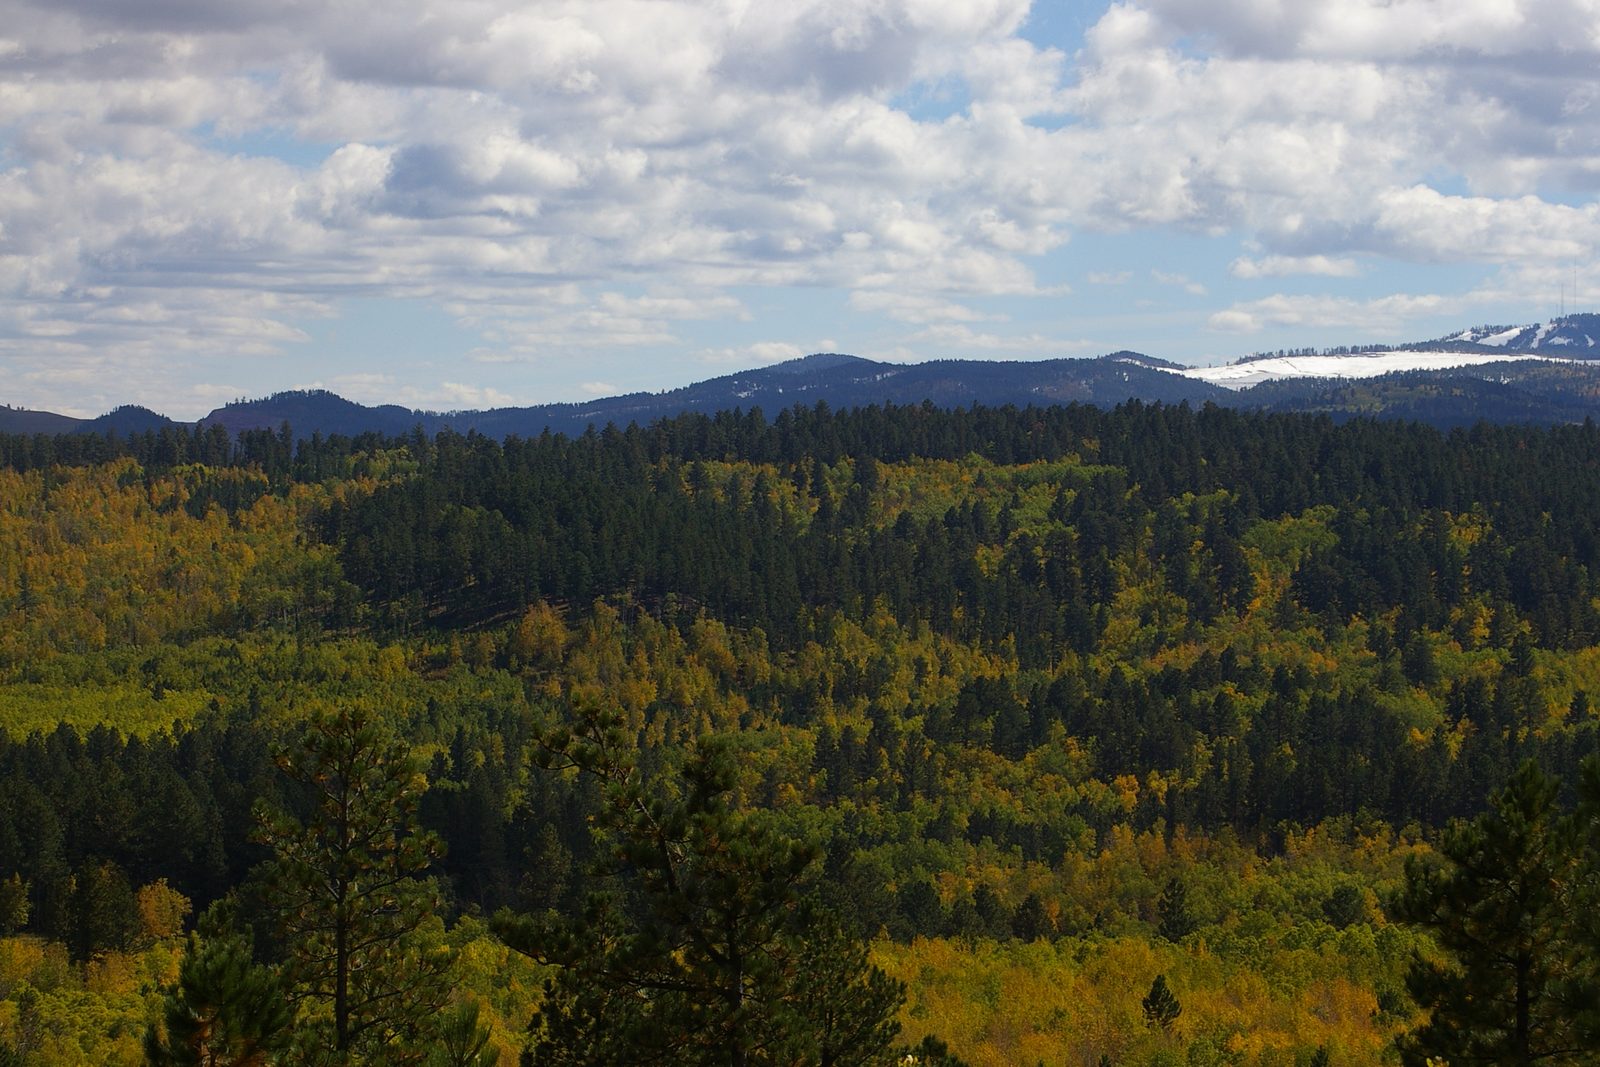
Behind the averages, the years swing widely. At the Rapid City airport, where records began in 1942, the wettest year was 2019, with 28.43 inches, and the driest 1974, with 9.12, the Weather Service’s records show. The year 2019 was also the airport’s coldest, averaging 43.2°F; 2012 and 2024 tied as the warmest, at 50.4°F.
Chinooks and the Morning of January 22, 1943
Winter’s warm spells come on the wind. Pacific air drops its moisture climbing the Rocky Mountains and warms as it sinks down their eastern side, the Park Service explains, and those warm, dry winds are chinooks. In 1943 Roland R. Hamann, senior observer at the U.S. Weather Bureau office in Rapid City, wrote that the chinook “may be considered a prominent climatological factor” there. Ranchers on the northern cattle range knew the wait for one, as The Winter of 1886–87 on the Cattle Range tells.
Hamann was writing in the March 1943 Monthly Weather Review about something stranger. In mid-January, Arctic air poured over the Great Plains and stayed, and the Black Hills lay close to its western edge. From January 20, milder Pacific air flowed in above it. Lead and Custer warmed into the 30s that day while Spearfish and Rapid City stayed below zero, the Weather Service’s account says.
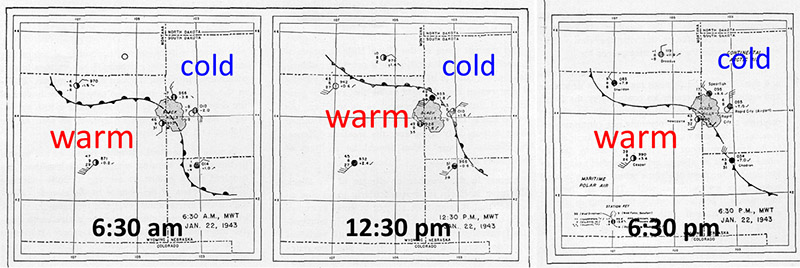
On the morning of January 22 the edge of the cold air rocked back and forth along the northern and eastern foot of the Hills. At Spearfish a recording thermometer at the Montana-Dakota Utilities office showed the temperature jump from −4°F to 45°F in two minutes at 7:32 a.m., and later fall from 54°F at 9 a.m. to −4°F at 9:27. In Rapid City at 11 a.m., Hamann wrote, it was winter on the east side of the Alex Johnson Hotel and spring around the corner, less than 50 feet away. Frost glazed windshields in an instant and forced drivers to stop. A Weather Bureau inspector heard that Lead stood at 52°F while Deadwood, 3 miles away and 600 feet lower, stood at −16°F, and that plate glass windows cracked in Lead.
Many blamed a chinook, but Hamann doubted that much warming by sinking air took place over the Hills. He traced the swings to a stalled front between Arctic and Pacific air, its cold side washing up and down the slopes like a tide around an island, perhaps helped by local chinook effects. By the evening of January 23 the cold had covered the region again. The event made the Ripley’s Believe It or Not cartoon in newspapers nationwide, the Weather Service says (see Spearfish, South Dakota).
Hail, Cloudbursts and the 1972 Flood
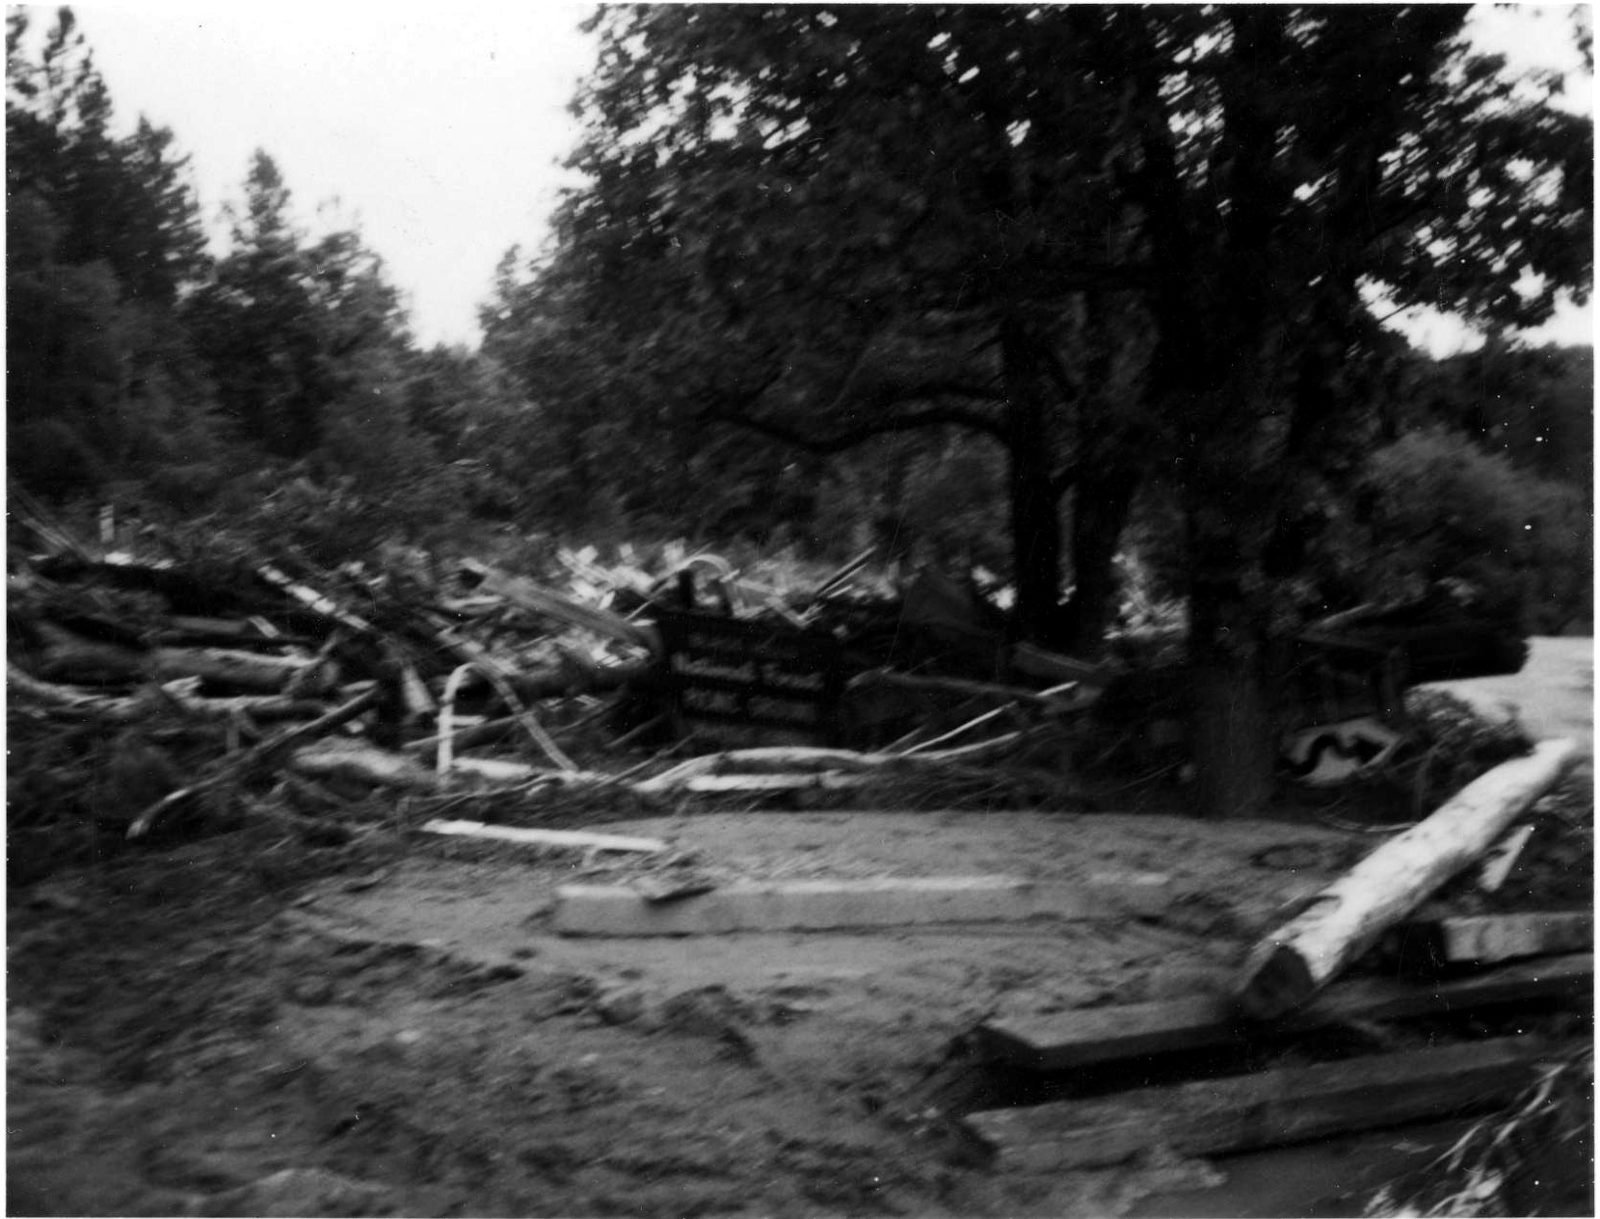
Summer storms can build over the Hills themselves. On June 9, 1972, by the Weather Service’s account, strong east winds pushed moist air up the slopes and two areas of thunderstorms formed over the Black Hills, held in place by those winds near the ground and light winds aloft. As much as 15 inches of rain fell near Nemo and Sheridan Lake, while the Rapid City airport, on the plains, recorded 2.08 inches that day. The flood killed 238 people across the Black Hills, the Weather Service says; its full story is on Rapid City, South Dakota.
Hail can pile up like snow. On July 27, 2015, storms dropped hailstones up to 3.5 inches across at a spot 3 miles east-southeast of Hill City, and so much hail fell in Custer that it looked like a snowfall, the Weather Service reported. On June 25, 2020, a storm over Custer left enough hail that plows had to clear the roads. At Wind Cave, the Park Service warns that a storm that barely moves can drop a great deal of rain on one small area and set off a flash flood, and it tells campers near creek beds, even dry ones, to move uphill if flooding starts.
Connected
- Winter in the HillsHow much snow falls at Lead, Rapid City and Hot Springs, and the winter sports it carries.
- Rapid City, South DakotaThe full story of the June 9, 1972 flood and the greenway built after it.
- Spearfish, South DakotaThe town whose thermometer jumped 49 degrees in two minutes in January 1943.
- The Winter of 1886–87 on the Cattle RangeThe hard winter on the ranges around the Hills, and the painting called Waiting for a Chinook.
- How the Black Hills FormedThe dome that lifts the Hills above the plains and into cooler, wetter air.
- The Southern HillsThe warmer, drier end of the Hills, from Custer to Hot Springs.
- Wind Cave National ParkThe park in the warmer, drier southern Hills, where June and July storms can bring large hail.
- Lead, South DakotaThe mining town whose weather station records the most precipitation of the four.
Sources
- Rapid City Regional Airport: 30-Year Normals (1991–2020) and Climate Records. National Weather Service, Rapid City, SD, 2026.
- Lead, SD: 30-Year Normals (1991–2020) and Climate Records. National Weather Service, Rapid City, SD, 2026.
- Hot Springs, SD: 30-Year Normals (1991–2020) and Climate Records. National Weather Service, Rapid City, SD, 2026.
- U.S. Climate Normals, 1991–2020: Monthly Normals, Custer, SD (station USC00392087). NOAA National Centers for Environmental Information, 2021.
- U.S. Climate Normals, 1991–2020: Annual and Seasonal Normals, Custer, SD (station USC00392087). NOAA National Centers for Environmental Information, 2021.
- U.S. Climate Normals, 1991–2020: Annual and Seasonal Normals, Hot Springs, SD (station USC00394007). NOAA National Centers for Environmental Information, 2021.
- U.S. Climate Normals, 1991–2020: Annual and Seasonal Normals, Lead, SD (station USC00394834). NOAA National Centers for Environmental Information, 2021.
- U.S. Climate Normals, 1991–2020: Annual and Seasonal Normals, Rapid City Regional Airport, SD (station USW00024090). NOAA National Centers for Environmental Information, 2021.
- Weather (Wind Cave National Park). National Park Service.
- Hydrology of the Black Hills Area, South Dakota (Water-Resources Investigations Report 02-4094), by Daniel G. Driscoll, Janet M. Carter, Joyce E. Williamson and Larry D. Putnam. U.S. Geological Survey, 2002.
- The Black Hills Remarkable Temperature Change of January 22, 1943. National Weather Service, Rapid City, SD.
- The Remarkable Temperature Fluctuations in the Black Hills Region, January 1943, by Roland R. Hamann. Monthly Weather Review 71, no. 3, U.S. Weather Bureau, 1943.
- The Black Hills Flood of 1972. National Weather Service, Rapid City, SD.
- July 27: Hail (Snow) Storm. National Weather Service, Rapid City, SD, 2015.
- June 25: Custer Hail Storm. National Weather Service, Rapid City, SD, 2020.
Last reviewed: